This is an evaluative research study I led at Insider. The high-level objective was to understand the reason behind low adoption rates and usability issues as well as users' needs and expectations regarding Smart Journey Creator feature in Architect (Insider’s Journey Builder). This feature enables digital marketers to create omni-channel marketing automation flows powered by Insider’s AI solution, Sirius AI™.
The research identified key gaps in in-product guidance and transparency in AI-generated outputs, leading to design improvements that increased feature adoption by 42% within 3 months.
About Insider 🦄
Insider is a Sequoia-backed unicorn and B2B SaaS platform offering marketing technology solutions for leading global businesses.
My Role: Since joining Insider in 2023, I have been responsible for the design research process for one product area and a cross-functional product team. I collaborated closely with the Product Design, Product Management, Development, Customer Success, and Data Warehouse teams.
Disclaimer: Certain details and visuals on this page have been removed or adjusted due to confidentiality. The images included are from the final report and serve to showcase my research reporting skills; they may differ from the actual outcomes.
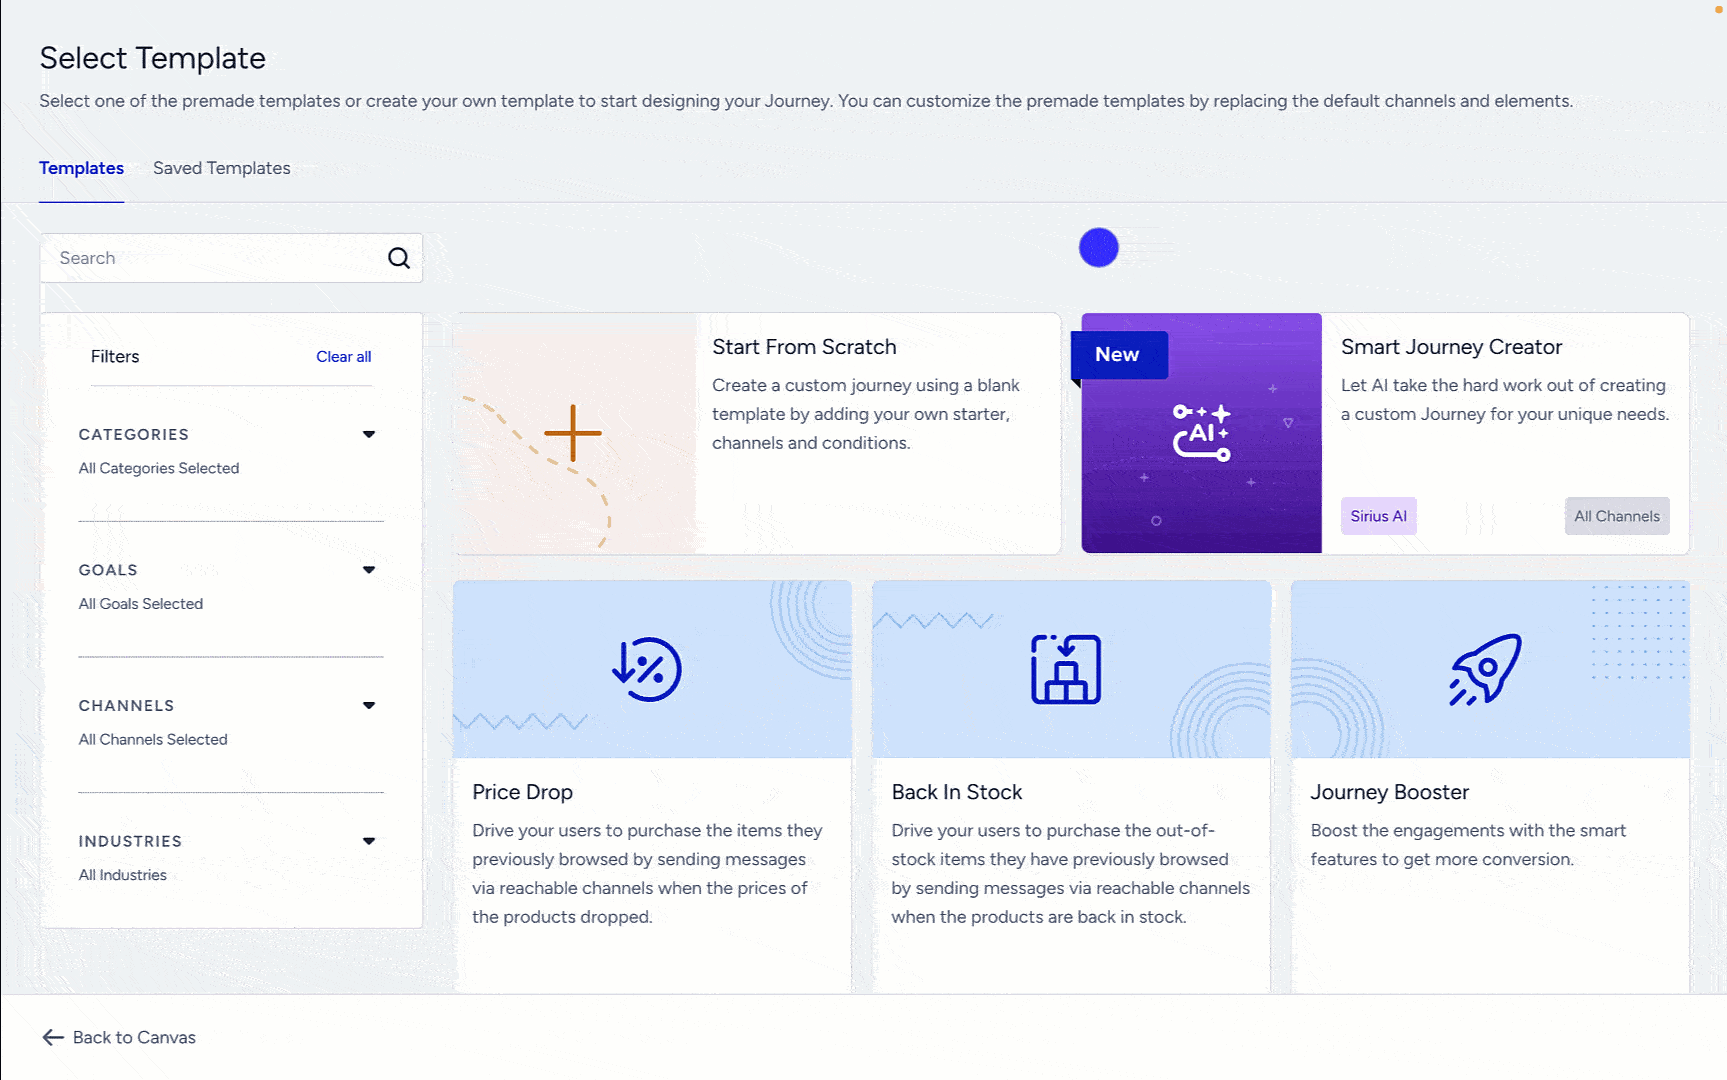
Smart Journey Creator in Architect: See it in action.
Process
Background & Goals 🎯
After the release of the beta version of the Smart Journey Creator feature in Architect, the initial user feedback and early signals suggested that users might not be fully aware of its capabilities and limitations. Additionally, we observed low adoption rates and high-drop-off, with most users discontinuing their use after their initial trial. Therefore, we decided to undertake a user research study to investigate these issues further.
Our main aim was to gather rich qualitative insights into users' interactions with the feature, identifying existing usability issues and pain points. The ultimate goal was to improve feature usability and adoption while reducing time-to-value (TTV).
Methodology 💼
I employed a mixed-methods approach combining behavioral analytics (FullStory) and moderated usability testing to understand both what users were doing and why they were struggling. I analyzed key usage metrics (e.g., sessions, session duration, rage clicks, user flows, and prompts) to identify behavioral patterns, and complemented this with moderated usability testing to uncover users’ pain points, needs, and expectations. I also conducted a log analysis on user prompts submitted to the bot.
Participant Criteria 👤
I defined two user segments based on our assumption that users' expectations of the feature, and consequently their experience with it, would differ depending on their experience levels with the Architect product. I conducted the usability testing with 10 participants in total from the following user segments:
1. Experienced users: Enterprise-level customers who have used the Smart Journey Creator feature at least once and with good Architect knowledge/proficiency based on customer age/lifetime & panel usage.
2. New users: Newly onboarded users who have not used the feature yet and with limited product knowledge.
Usability Testing 🧪
I designed the tasks to observe how participants would interact with the feature in a real-life context. If the participant couldn't imagine a use case during the test, I've given them a pre-defined use case.

A journey generated by the Smart Journey Creator based on a user prompt. This screenshot is from the new version of the feature, enhanced based on the findings and insights from this study.
Results
Key Insights from the Study 💡
Insight #1: Guidance 🧭
Providing step-by-step guidance during prompt entry can help users achieve their desired outcomes more effectively.
Challenge ⚔️
We observed that;
● Users struggle to interact with the Smart Journey Creator due to insufficient guidance on writing prompts.
● Users feel confused and frustrated when receiving unexpected or erroneous results, as they don’t know how to refine their prompts to better align with their goals and the current capabilities of the feature.
Recommendation💡
Introduce step-by-step guidance on input expectations to help users craft effective prompts while maintaining flexibility for users to describe their intentions freely.
Insight #2: Reasoning Behind Results 🧠
Providing reasoning behind the generated results to support the reliability of the feature and help users make sense of the result.
Challenge ⚔️
I found out that;
● Users need to understand the justification/reasoning behind the generated journey to determine how to use it in accordance with their goals.
Recommendation💡
● Providing a brief explanation of the generated journeys, as to which criteria the journey logic is created (e.g., based on your database/most used channels), can help users to better make sense of the results and increase the perceived reliability of the feature.
● A reasoning behind the results is often provided on some AI tools, such as ChatGPT.

Some key insights from the final UXR report (the rest is blurred due to confidentiality).

Key themes emerged from the qualitative data analysis (numbers adjusted for confidentiality).
Prioritization & Ideation 📊
After the data analysis, I created user stories for each insight to help the team prioritize tasks. These were ranked by issue frequency, importance from a UX POV, and the effort required for development.
Research Impact 🏆
Strategic & Product Impact
● The research guided product development and informed key feature improvements 🧭
● Feature adoption increased by 42% within three months after implementation 📈
● Product designers, developers, and product managers successfully incorporated actionable insights from the research into the product, enhancing its usability and overall user satisfaction 🚀